
Ubigene KO Cells Help Reveal How PCNSL Adapts to Low Glucose Through SLC2A5-Mediated Fructose Metabolism

Study Overview
Primary central nervous system lymphoma (PCNSL) is an intracranial non-Hodgkin lymphoma with an extremely poor prognosis. Its tumor microenvironment (TME) is characterized by low glucose and hypoxia; however, how this TME drives metabolic reprogramming in both tumor cells and microenvironmental cells remains largely unexplored. A team led by Gang An and Yuxuan Liu at the Institute of Hematology & Blood Diseases Hospital, Chinese Academy of Medical Sciences, in collaboration with Qingguo Li's team at Huanhu Hospital Affiliated to Tianjin Medical University, published a study in Advanced Science. The study revealed that the low-glucose microenvironment drives tumor cells to upregulate the fructose transporter SLC2A5 and shift toward fructose metabolism, while hypoxia induces SLC2A5 expression in tumor-supportive macrophages through an HIF-dependent mechanism. In vitro and in vivo experiments demonstrated that genetic or pharmacological blockade of SLC2A5-mediated fructose uptake significantly suppresses lymphoma growth, providing a novel metabolic targeting strategy for PCNSL. The SLC2A5 knockout U-2932 cell line was provided by Ubigene.
Background
Primary central nervous system lymphoma (PCNSL) is a rare extranodal non-Hodgkin lymphoma that primarily affects the brain parenchyma, accounting for approximately 2%-3% of all central nervous system tumors. Although pathologically classified as diffuse large B-cell lymphoma (DLBCL), its prognosis is significantly worse, with a 5-year overall survival rate of only 30%-40%. High-dose methotrexate-based combination chemotherapy is the current standard regimen; however, primary resistance occurs in 15%-25% of patients, and 25%-50% of responders ultimately relapse, posing substantial clinical challenges. PCNSL harbors a distinct mutational landscape (e.g., B2M, GNA13) and a TME characterized by pronounced immunosuppression, hypoxia, and markedly reduced cerebrospinal fluid glucose levels. The dual pressures of low glucose and hypoxia not only limit the energy supply to tumor cells but may also reshape the function of immune cells within the TME. However, how this unique metabolic pressure coordinately drives metabolic reprogramming in both tumor cells and microenvironmental cells—and further shapes their survival advantages and immune evasion—had not been systematically dissected at the single-cell level. Single-cell multi-omics technologies now provide an unprecedented opportunity to unravel this complex interplay.
Key Findings
1. A Single-Cell Atlas of PCNSL and Non-Tumor Controls
To dissect the cellular composition of the PCNSL TME, this study performed single-cell RNA sequencing and BCR sequencing on tumor, tumor-adjacent, peripheral blood, and injured brain samples, yielding over 140,000 cells. In tumors, B cells accounted for 74.64%, T cells 10.65%, and macrophages/microglia 12.89%; the tumor-adjacent composition was similar. Injured brain tissue was dominated by myeloid cells (macrophages/microglia 32.99%, monocytes 16.53%) and oligodendrocytes (38.55%); peripheral blood was predominantly composed of T cells, NK cells, and monocytes (>94%). This atlas systematically delineated the immune landscape across different anatomical sites, providing a foundational reference for subsequent studies on macrophages, B cell clones, and microenvironmental interactions.
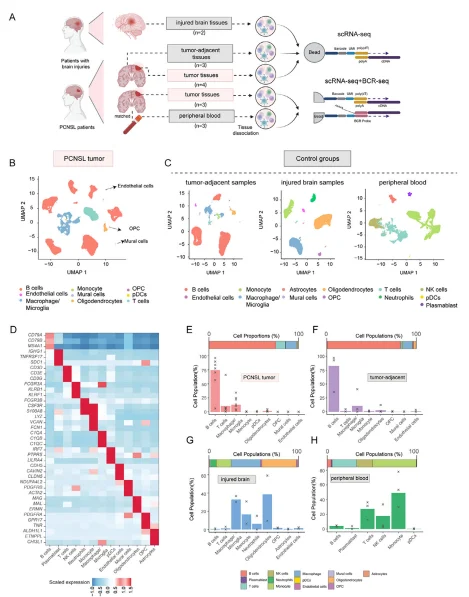
Figure 1. Single-cell landscape of PCNSL and control samples
2. Single-Cell Characterization of B Cells in PCNSL and Control Samples
Single-cell transcriptomics combined with BCR sequencing systematically resolved B cell characteristics in PCNSL tumor, tumor-adjacent, and peripheral blood samples. Tumor and tumor-adjacent B cells exhibited high patient-specific heterogeneity (confirmed by Shannon entropy), whereas peripheral blood B cells clustered uniformly. Light chain analysis showed that tumor and tumor-adjacent B cells expressed only kappa light chains, and tumor-adjacent B cells harbored PCNSL-characteristic CNV alterations (6p21/19p13 loss, 18q21 gain), indicating their malignant nature. In terms of differentiation state, tumor and tumor-adjacent B cells predominantly corresponded to various stages of germinal center (GC) B cells, while peripheral blood B cells were mostly naive/memory B cells. Clonal analysis confirmed that tumor B cells originated from a single clonal lineage, and dominant clones were not detected in peripheral blood. Although tumor B cells were clonally related, they exhibited diverse transcriptional states encompassing cell cycle, DNA replication, and endoplasmic reticulum stress metaprograms, with a plasmablast-like signature associated with poor prognosis. In summary, tumor-adjacent tissues harbor occult malignant B cells, supporting the use of systemic chemotherapy/whole-brain radiotherapy; the intratumoral heterogeneity of B cells also provides new directions for precision immunotherapy.
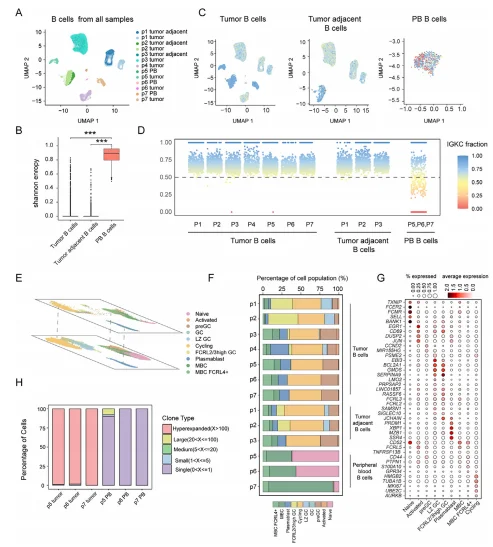
Figure 2. Characterization of B cells in PCNSL and control samples
3. Fructose Metabolism Is Upregulated in PCNSL
Comparative transcriptomic analysis of PCNSL tumor B cells versus peripheral blood normal B cells and systemic DLBCL revealed that PCNSL significantly downregulates MHC class II antigen processing and presentation genes (e.g., HLA-DRA, HLA-DRB1). This downregulation may be attributed to recurrent genomic loss of chromosome 6p21.32, which harbors the HLA locus. Reduced HLA class II expression may facilitate immune evasion of PCNSL tumor cells from CD8⁺ cytotoxic T cells. In addition to pathways known to be associated with aggressive B-cell lymphoma, such as protein misfolding, cell cycle regulation, and B-cell activation and differentiation, we observed marked upregulation of the fructose transporter SLC2A5 and fructose metabolism pathways in PCNSL. High-grade lymphomas are characterized by elevated glucose uptake. Brain ¹⁸F-FDG PET imaging shows that PCNSL exhibits markedly elevated FDG uptake, indicative of enhanced glucose transport and glycolysis. However, physiological glucose levels in CSF are lower than those in serum, approximating 60% of serum glucose concentrations, and glucose levels in brain interstitial fluid are even lower. In patients with CNS lymphoma, CSF glucose levels have been reported to drop below the physiological level of 50 mg/dL in more than half of cases. Thus, the high glucose demand of PCNSL cells, combined with limited glucose availability, may force these cells to utilize alternative nutrient sources. Compared to DLBCL, PCNSL exhibited more aggressive characteristics, with significant upregulation of ATP metabolism and mitotic cell cycle pathways. Genes including CD44 and IL-10 were also upregulated in PCNSL. CD44 may be involved in the homing of lymphoma cells into the CNS, and IL-10 has been proposed as a diagnostic biomarker for PCNSL. Similar to the comparison between PCNSL and PB, the fructose metabolism pathway and genes associated with fructose metabolism, such as SLC2A5, ALDOC, TPI1, and FBP1, also showed upregulation in PCNSL compared to DLBCL, indicating that low glucose conditions in the CNS may drive PCNSL to utilize fructose metabolism as a crucial alternative energy source. SLC2A5 encodes the fructose transporter GLUT5. Immunohistochemical staining using antibodies against GLUT5 and CD20 confirmed that regions with high CD20 expression also exhibited strong GLUT5 expression. METAFlux analysis inferred increased fructose uptake and enhanced fructose-related metabolic activity in PCNSL compared with DLBCL and PB. Together, these findings indicate that SLC2A5-mediated fructose metabolism is specifically upregulated in PCNSL, potentially reflecting metabolic reprogramming of PCNSL tumor cells as an adaptive response to the low-glucose environment of the CNS
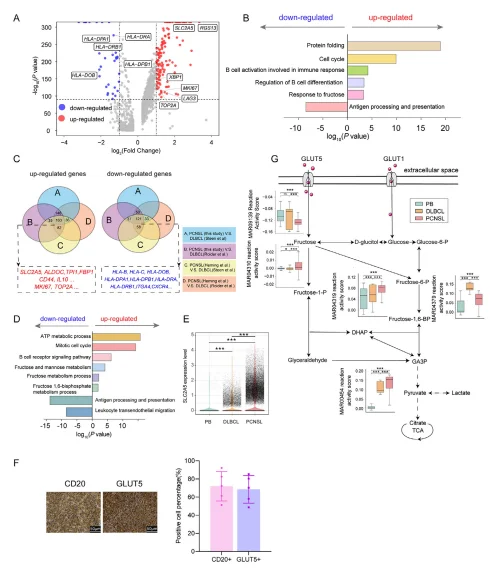
Figure 3. Fructose metabolism is upregulated in PCNSL
4. Hypoxic mo-TAMs Reprogram Fructose Metabolism via the HIF–SLC2A5 Axis
Single-cell analysis revealed that macrophages/microglia in PCNSL could be divided into mg-TAMs (high expression of homeostatic markers, predominantly located in tumor-adjacent tissue) and mo-TAMs (high expression of CD163, primarily enriched in tumors). Hypoxic mo-TAMs constituted the dominant subset, with upregulation of hypoxia-related genes, MMP9, CXCL8, and IL-10, and downregulation of MHC class II and antigen presentation pathways, exhibiting a tumor-supportive phenotype. This subset significantly overexpressed the fructose transporter SLC2A5, and HIF-1α/2α directly bound to its regulatory regions under hypoxic conditions, promoting SLC2A5 expression and driving increased fructose uptake. This hypoxia–HIF–SLC2A5–fructose metabolism axis provides a new target for metabolic targeting of TAMs in immunotherapy.
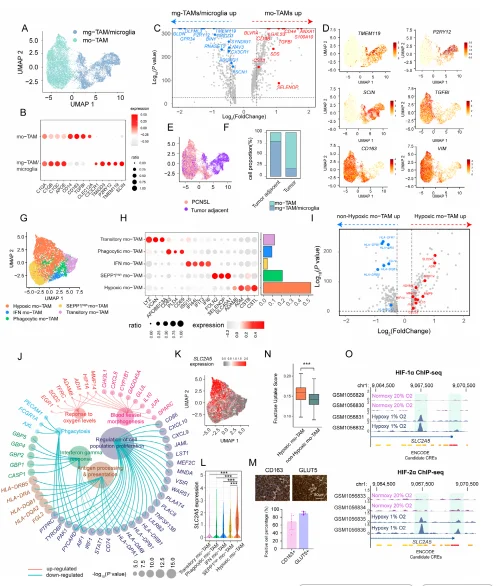
Figure 4. Characterization of macrophages and microglia in PCNSL
5. Blocking Fructose Utilization Suppresses B-Cell Lymphoma Growth Under Low-Glucose Conditions
In vitro experiments demonstrated that fructose supplementation significantly promoted proliferation of the DLBCL cell line U-2932 under low-glucose or glucose-deprived conditions, whereas this effect was minimal or absent under normal or high-glucose conditions. SLC2A5 knockout or treatment with the fructose analog 2,5-anhydro-D-mannitol (2,5-AM) completely abolished fructose-stimulated cell proliferation and colony formation. In an orthotopic PCNSL model in NSIG mice, 2,5-AM treatment or SLC2A5 knockout significantly suppressed lymphoma growth and prolonged overall survival.
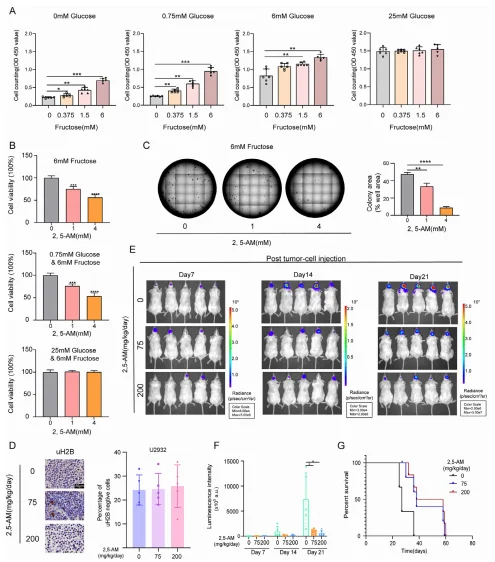
Figure 5. Pharmacological inhibition of fructose utilization suppresses lymphoma growth under low-glucose conditions
Summary
This study reveals, for the first time, a dual metabolic reprogramming mechanism in PCNSL: under the low-glucose microenvironment, tumor cells upregulate SLC2A5 expression and initiate fructose metabolism as an alternative energy source; meanwhile, the hypoxic microenvironment activates HIF-mediated transcriptional programs to drive tumor-supportive monocyte-derived tumor-associated macrophages (mo-TAMs) to upregulate SLC2A5 expression. Therefore, SLC2A5/fructose metabolism represents a shared vulnerability of both tumor cells and microenvironmental cells, and its blockade effectively suppresses lymphoma growth. This discovery provides a new "metabolic intervention" strategy for PCNSL and lays a theoretical foundation for the clinical translation of GLUT5-targeted drugs and dietary fructose restriction.
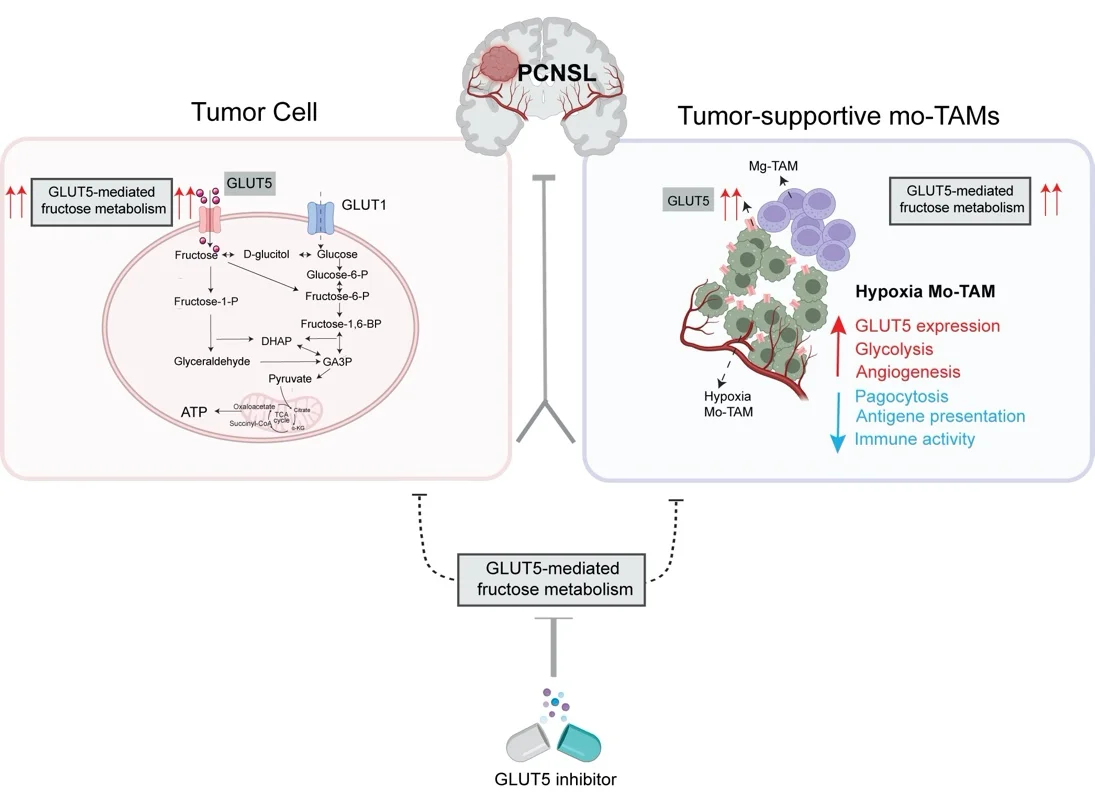
Figure 6. Proposed mechanism
Support Provided by Ubigene
In this study, the
SLC2A5 knockout U-2932 cell model
provided by Ubigene served as a critical cell tool for the key in vitro
and in vivo functional experiments validating fructose metabolism as a
therapeutic target in PCNSL.
Ubigene remains committed to the core philosophy of "Making Gene
Editing Easier," continuously innovating its products and services.
To date, we have achieved over 13,000 successful gene editing cases and
offer more than 10,000 KO cell products with WB guarantee. Our
proprietary innovative technology achieves knockout efficiency of up to
97%. Ubigene has provided high-quality gene editing services and
products to over 10,000 life science laboratories, pharmaceutical
companies, and CROs worldwide.
If you are studying SLC2A5, Ubigene offers several knockout cell
lines.
Contact us for more information.
 Promotions