CRISPR Library Screening Analysis: How Algorithm Differences Impact Your Results

Abstract
CRISPR library screening (CRISPR screen) is a powerful high-throughput tool in functional genomics, widely used for identifying disease genes, drug targets, and resistance mechanisms. However, one critical factor is often overlooked: data analysis . Even with a well-designed experiment, selecting inappropriate CRISPR screen analysis tools or algorithms can significantly bias results. Differences in statistical models, normalization strategies, and multiple testing corrections can lead to inconsistent candidate gene lists, ultimately affecting the reliability of scientific conclusions.
Why CRISPR Screen Data Analysis Matters
Imagine solving a math problem with a faulty calculator—the answer will inevitably be wrong. CRISPR library screening operates similarly: even with meticulous experimental design, selecting the wrong data analysis tool can lead to wrong results.
-
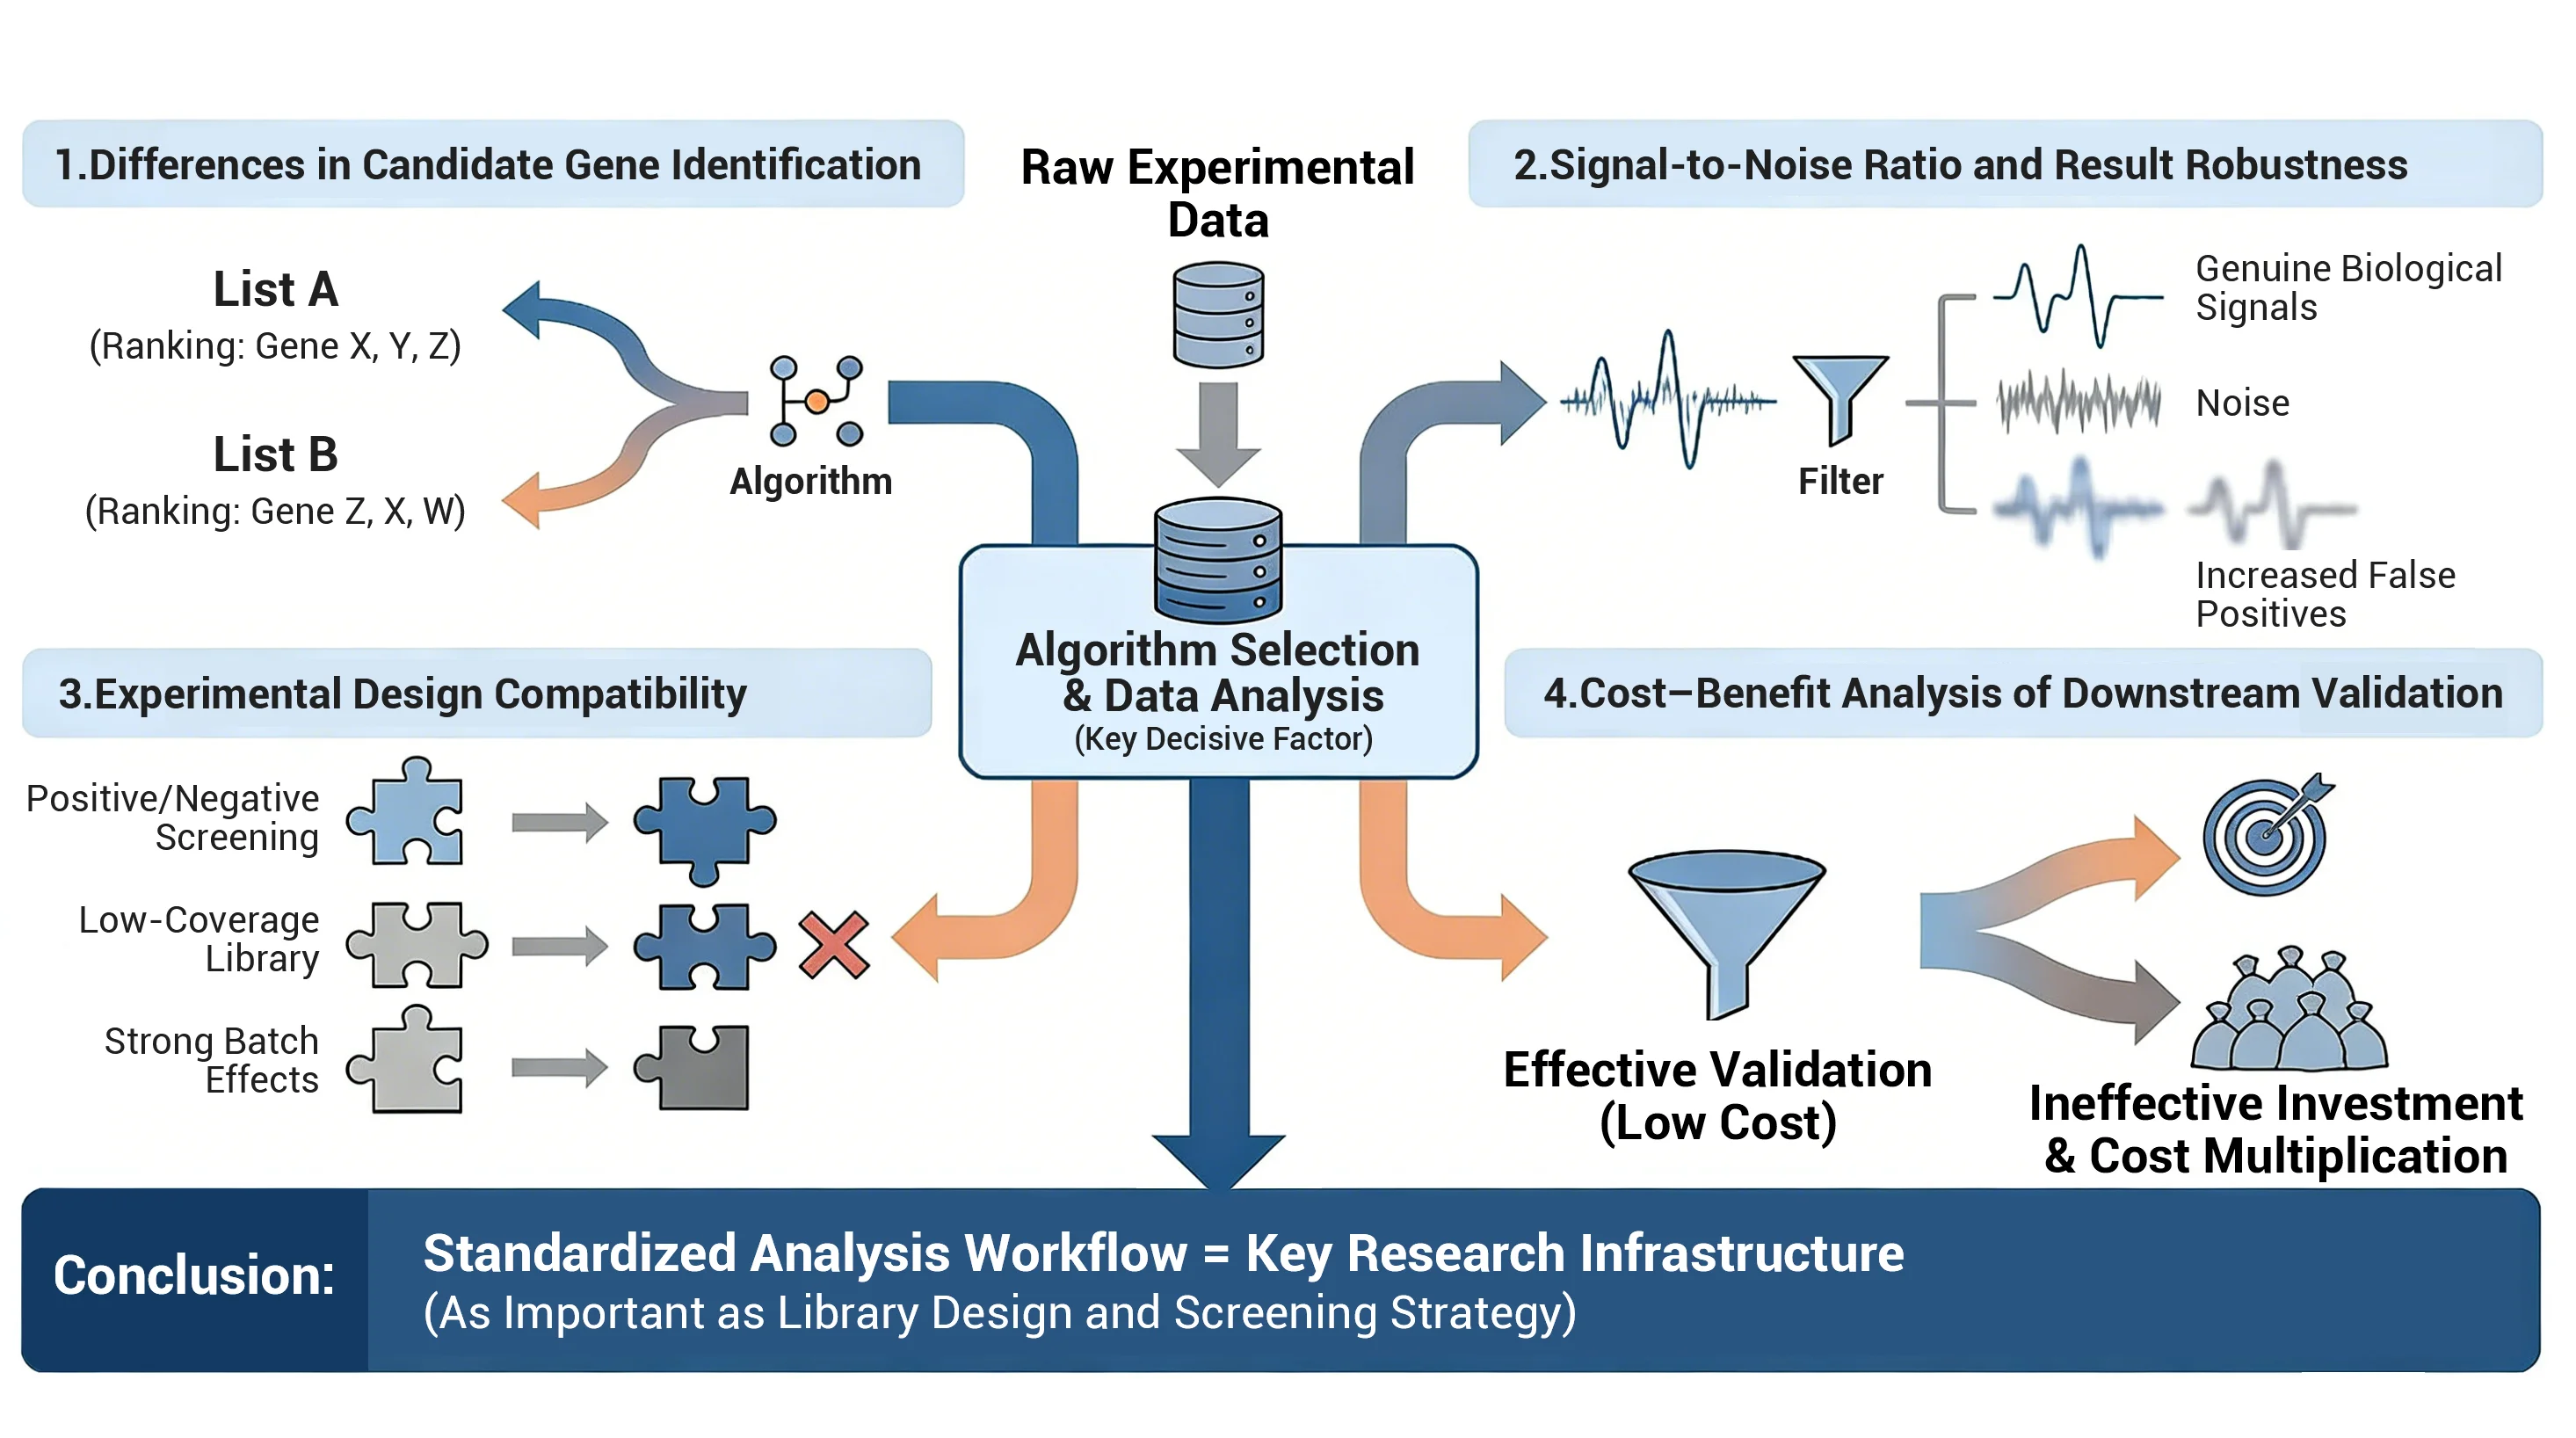
Significant Differences in Candidate Gene Identification
Different algorithms are like different calculator brands. The candidate genes produced from the same dataset may vary significantly, even in ranking order. This means a gene you thought was crucial could be overlooked by another algorithm. -
Signal-to-Noise Ratio and Result Robustness
Some algorithms function like sensitive radar, precisely capturing genuine biological signals; others are prone to interference from "technical noise," increasing false positives while missing true positives. Choosing an unsuitable tool is like listening to a symphony through subpar headphones—all the details are lost. -
Experimental Design Compatibility
Forward/negative screening, low library coverage, small replicates, or significant batch variation—different experiments demand distinct statistical assumptions from algorithms. Mismatched algorithms may introduce systematic biases, ultimately misleading downstream validation. -
Downstream Validation Costs
Screening yields dozens to hundreds of candidate genes, demanding substantial time and funding for functional validation. A sloppy analysis phase can squander experimental resources, leaving researchers "exhausted."
Conclusion: Establishing standardized, reproducible data analysis workflows is as critical as library design and experimental strategy for ensuring research efficiency and result reliability.
Overview of CRISPR Screen Analysis Tools
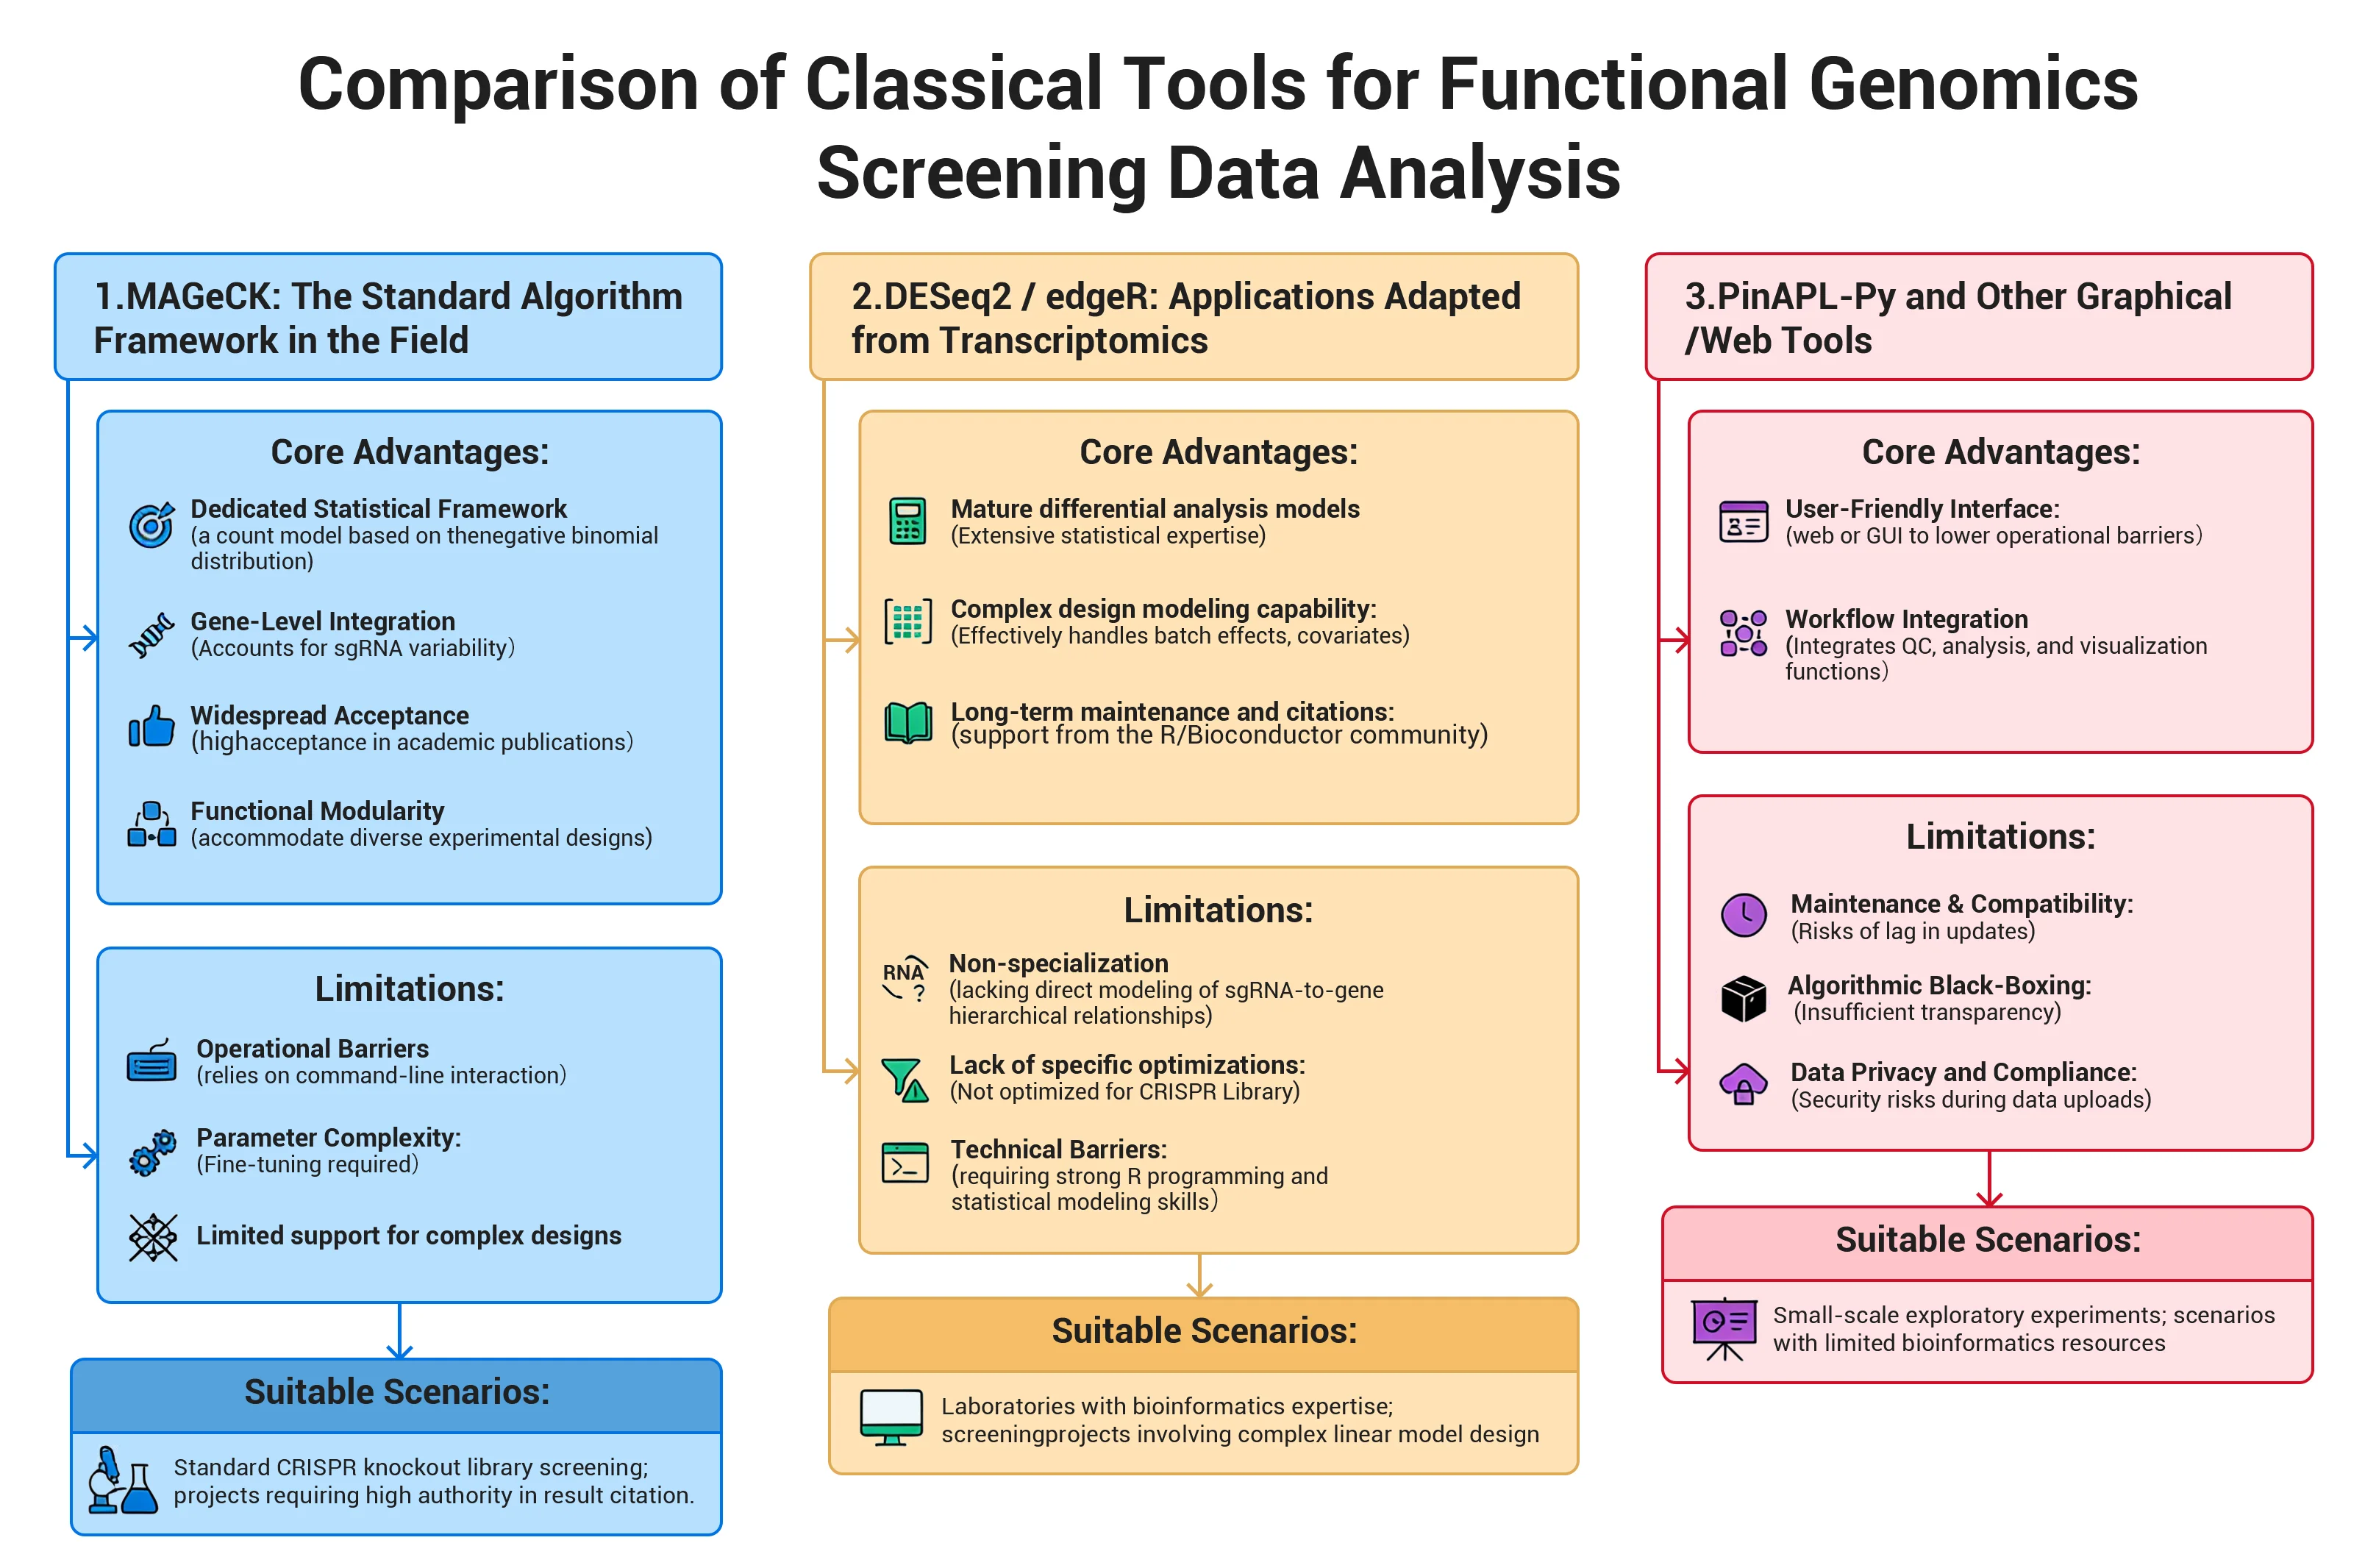
1. MAGeCK: The "Veteran" of CRISPR Library Screening
Core Advantages:
- Dedicated Statistical Framework: Employs a count model based on the negative binomial distribution, specifically designed for the data distribution characteristics of CRISPR screen data.
- Gene-Level Integration: Accounts for sgRNA variability, supporting scoring integration from the sgRNA level to the gene level.
- Widespread Acceptance: As a mature community tool, its analysis results enjoy high acceptance in academic publications.
- Functional Modularity: Offers modules like mageck test and mageck mle to accommodate diverse experimental designs.
Limitations:
- Operational Barriers: Primarily relies on command-line interaction, presenting technical hurdles for researchers without bioinformatics expertise.
- Parameter Complexity: Fine-tuning is required for parameters like normalization, control group definition, and sgRNA filtering thresholds.
- Limited support for complex designs: Lack of flexibility when handling multi-factor complex experimental designs.
Suitable Scenarios: Standard CRISPR knockout library screening; projects requiring high authority in result citation.
DESeq2 / edgeR: "Masters of the Bioinformatics Side Hustle"
Core Advantages:
- Mature differential analysis models: Extensive statistical expertise in negative binomial modeling, normalization, and variance estimation for discrete count data.
- Complex design modeling capability: Effectively handles batch effects, covariates, and multi-factor interaction designs via Design Matrix.
- Long-term maintenance and citations: Strong support from the R/Bioconductor community with extensive literature citations.
Limitations:
- Non-specialized limitations: Primarily designed for RNA-seq, lacking direct modeling of sgRNA-to-gene hierarchical relationships.
- Lack of specific optimizations: Not optimized for CRISPR library-specific biases, sgRNA truncation, and other characteristics.
- Technical Barriers: Complex parameters and functionality make understanding and application challenging, requiring strong R programming and statistical modeling skills.
Suitable Scenarios: Laboratories with bioinformatics expertise; screening projects involving complex linear model design; research requiring unified analysis frameworks with RNA-seq workflows.
3. PinAPL-Py and Other Graphical/Web Tools: "User-Friendly for Beginners"
Core Advantages:
- User-Friendly Interface: Provides web or graphical user interfaces (GUI) to lower operational barriers.
- Workflow Integration: Typically integrates quality control, differential analysis, and visualization functions.
Limitations:
- Maintenance and Compatibility: Some tools have delayed updates, posing environment compatibility risks.
- Algorithm Black Box: Insufficient transparency in parameters and model details, making it difficult to meet the needs of deep customization.
- Data Privacy and Compliance: Public web platforms may pose security risks during data uploads.
Suitable Scenarios: Educational demonstrations; small-scale exploratory experiments; scenarios with limited bioinformatics resources and low data privacy sensitivity.
Best CRISPR Screening Analysis Platform (iScreenAnlys™)
In CRISPR library screening experiments, while experimental design and library construction are crucial, data analysis often proves the most challenging step for researchers—marked by tons of tools, fragmented workflows, complex operations, and teamwork issues. To address these issues, Ubigene has self-developed the iScreenAnlys™ Library Analysis Platform, delivering a truly integrated CRISPR Screen data analysis and visualization solution.The platform is highly integrated, plug-and-play, and researcher-friendly, enabling scientists to focus on their research rather than tool operation.
Highlights of the iScreenAnlys™ library analysis system:
-
1.End-to-End Workflow Integration
iScreenAnlys™ supports a complete closed-loop workflow from importing raw count matrices or FASTQ sequencing data through data quality control (QC), normalization, differential analysis, visualization chart generation, and report export. Researchers can complete the entire analysis process from data to results with only one tool, no need to switch between multiple tools. -
2. Deep Optimization for CRISPR Scenarios
The system incorporates statistical models tailored for CRISPR screening characteristics (such as negative binomial regression and Bayesian inference frameworks) and provides open R package interfaces. It flexibly supports complex experimental designs including positive/negative screening and multi-condition comparisons. This approach meets the ease-of-use requirements for beginners while also accommodating the custom analysis capabilities of advanced users. -
3. Powerful visualization and interactivity
Generate and download rich visualizations with a single click, including sgRNA distribution maps, library coverage analysis, sample clustering, volcano plots, and enrichment analysis charts. These graphics are ready for immediate use in publications, reports, or presentations, reducing the burden of scientific data visualization. -
4. Traceable and Reproducible Analysis Processes
The system permanently stores all results and parameter settings from each analysis. Backend auditing mechanisms ensure analysis workflows are reproducible and traceable, meeting the requirements for paper review and project archiving. Researchers no longer need to worry about "unverifiable experimental results." -
5. Collaboration-friendly and highly scalable
Supports parallel management of multiple projects and online data sharing, resolving issues of file disorganization and version control in traditional multi-user collaboration. The platform architecture also reserves expansion space, allowing integration of additional modules based on research team needs to enhance overall team efficiency.
Design Philosophy: iScreenAnlys™ Library Analysis Platform does not aim to replace classical algorithms. Instead, it structurally encapsulates established methodologies through engineering, further integrating and contextualizing them for specific applications. With the goal of "making gene editing easier," Ubigene enhances the efficiency, stability, and usability of CRISPR library screening data analysis, it serves as an "intelligent assistant" for CRISPR library screening data analysis, making research more efficient, intuitive, and controllable.
Key Metrics for Selecting CRISPR Library Screening Analysis Tools
When selecting CRISPR library screening analysis tools, functionality alone is insufficient. Scientists typically evaluate tools' actual performance through quantitative metrics to ensure reliable and reproducible screening results. The following four metrics are particularly crucial:
1. Sensitivity and Specificity
- Sensitivity: Measures an algorithm's ability to identify true positive genes.
- Specificity: Measures the algorithm's ability to exclude technical noise and false positives.
- Evaluation Method: Benchmark against known "gold standard gene sets" (e.g., validated drug targets, core signaling pathways) by calculating the overlap rate of candidate gene lists.
- Core Principle: High sensitivity ensures no critical genes are missed, while high specificity guarantees reliable screening results.
2. False Discovery Rate Control (FDR Control)
- FDR (False Discovery Rate): One of the most critical metrics in high-throughput screening statistics, used to control the proportion of false positives.
- Control Strategy: Modern analysis tools should integrate standard correction algorithms like Benjamini–Hochberg while allowing users to flexibly set FDR thresholds based on exploratory or validation objectives.
- Visualization Support: Utilize visualization tools like volcano plots to highlight genes near threshold values, assisting researchers in comprehensive interpretation informed by biological context.
- Core Approach: Discover as many genuine signals as possible while avoiding excessive false positives that waste validation resources.
3. Robust Normalization
- Conventional Methods: Total Count Normalization, Median/Quantile Normalization.
- CRISPR-Specific Optimization: Normalization based on reference sgRNA or non-targeting control (NTC).
- Handling Extreme Samples: For samples with high cell lethality or strong selection pressure, select more robust algorithms and validate normalization outcomes using distribution line charts/histograms.
- Core Principle: Ensure data comparability across samples, yielding reliable results even under complex experimental conditions or with outlier data.
4. Coverage & Depth Analysis
- Metric Definitions: sgRNA coverage indicates library integrity; read depth reflects sequencing data abundance.
- Experimental Standards: Perform sgRNA distribution statistics and visualize sgRNA alignment library matching rates to effectively flag low-quality samples. Additionally, calculate the GINI index to assess library uniformity.
- Core Approach: Only through rational library design and sufficient sequencing can screening results be scientifically reliable.
Summary
When selecting CRISPR library analysis tools, it is recommended to comprehensively evaluate them based on sensitivity, specificity, false discovery rate control, normalization robustness, library coverage, and sequencing depth. This approach ensures data quality, reduces downstream validation costs, and provides a solid foundation for research decision-making.
How to Choose the Right CRISPR Analysis Tool
Different experimental designs present distinct data analysis challenges. Therefore, when selecting analysis tools or methods, adopt differentiated strategies based on experimental conditions to ensure reliable and interpretable results. Below are common experimental scenarios and recommendations:
1. Small Sample Size/Low Replication (e.g., n=2)
- Potential Risks: Insufficient sample size may lead to inadequate statistical power, unstable variance estimation, and miss or misidentify candidate genes.
- Analysis Strategy: Employ statistical methods of information borrowing (e.g., empirical Bayesian estimation, negative binomial regression). Leverage the pathway enrichment analysis module within the iScreenAnlys™ library analysis platform to enhance the biological interpretability of single-gene results.
- Core Approach: Statistically "amplify" information content while integrating pathway analysis to enhance reliability.
2. Large Samples/Complex Designs (Multiple Time Points, Multiple Doses)
- Potential Risks: Batch effects, unmodeled covariates, and other factors may confound genuine biological signals.
- Analysis Strategy: Employ DESeq2/edgeR's Generalized Linear Model (GLM) to handle complex designs. Configure contrast matrices and covariates, diagnosing and correcting batch effects via PCA/clustering analysis.
- Core Approach: Separate true signals from technical noise using established statistical modeling methods to ensure analytical reliability in complex designs.
3. Low Sequencing Depth/Insufficient Library Coverage
- Potential Risks: low-impact genes may be missed, and statistical conclusions may exhibit high variability.
- Analysis Strategy: Strictly enforce QC protocols to confirm sample viability. Avoid algorithms highly sensitive to low counts; focus on high-impact genes and pathway-level signals.
- Core Approach: Ensure analytical reliability to extract core insights even with suboptimal libraries or sequencing
4. Resource constraints (budget/lack of specialized personnel)
- Potential Risks: Difficulty maintaining complex bioinformatics workflows, leading to low analysis efficiency and increased error rates.
- Analysis Strategy: Select highly automated, user-friendly integrated platforms like the iScreenAnlys™ library analysis platform. This platform encapsulates standardized operating procedures (SOPs) for tools such as MAGeCK and DESeq2, reducing learning and maintenance costs.
Summary
Selecting analysis methods requires considering not only tool capabilities but also experimental conditions: sample size, experimental design complexity, sequencing depth, and resource availability.Implementing tailored strategies for different scenarios significantly enhances the reliability and interpretability of CRISPR library screening data. Throughout this process, Ubigene's iScreenAnlys™ Library Analysis Platform stands as an ideal choice for researchers conducting CRISPR library analysis. Its one-stop and end-to-end workflow, CRISPR-specific statistical models, visual interactive interface, and efficient team collaboration capabilities enable more efficient, robust, and controllable research.
Common Biases in CRISPR Screening Analysis
Researchers often encounter common pitfalls during CRISPR library data analysis. Understanding these biases and implementing corresponding measures can significantly enhance the reliability and interpretability of analytical results.
1. Reliance on Single-Dimensional Metrics
- Misconception: Focusing solely on p-values or FDR while neglecting signal strength and consistency
- Avoidance: Holistically evaluate log-fold change (logFC), consistency of sgRNA effects, and pathway enrichment results. Employ multidimensional visualizations for cross-validation.
- Core Principle: Look beyond "significance" to assess "biological relevance."
2. Neglecting Pre-Analysis Quality Control
- Misconception: Skipping quality control (QC) steps before proceeding with differential analysis.
- Avoidance: Prioritize checking sgRNA coverage/mapped rate, GINI index, and sample correlation. QC is an essential step in the analysis workflow.
- Core principle: Data quality underpins analytical reliability.
3. Inconsistency in Analysis Workflows
- Misconception: Switching between different analysis methods arbitrarily within the same study.
- Avoidance: Establish and follow standardized analysis templates to ensure comparability of results within and between projects.
- Core principle: Consistent processes yield reliable results.
4. Blind Use of "black-box" tools
- Misconception: Using tools to generate results without understanding the underlying algorithmic assumptions.
- Avoidance: Refer to the documentation provided by the analysis tool or seek support from the user community to understand the model's applicability and limitations.
- Core Principle: Only by understanding the principles can tools be used scientifically.
Summary
CRISPR library analysis is not merely data processing but a combination of scientific judgment and method selection. By focusing on multidimensional metrics, rigorous QC, standardized workflows, and judicious tool usage, the credibility and interpretability of analysis results can be maximized.
Conclusions and Practical Considerations
1. Comprehensive Conclusions
Classic tools (e.g., MAGeCK, DESeq2/edgeR) provide a robust statistical foundation for CRISPR screen data analysis. These mature, reliable methods have been extensively validated by the scientific community. The core advantage of the iScreenAnlys™ library analysis platform is not the reinvention, but rather leveraging these methods more thoroughly through engineered integration.The platform encapsulates rigorous statistical cores within a unified, visualizable analysis workflow, achieving end-to-end coverage from data quality control → model analysis → result interpretation. For most of research scenarios, iScreenAnlys™ invokes and enhances classical algorithms in a standardized manner, making the analysis process more stable, parameters more transparent, and results more reproducible.
While maintaining academic rigor, the iScreenAnlys™ library analysis platform significantly boosts research efficiency and multi-project management capabilities. This allows researchers to focus more intently on the scientific questions themselves, rather than being bogged down by cumbersome toolchains. In other words, iScreenAnlys™ does not replace classic tools; it makes existing methods more efficient, easier to use, and more reliable.
2. Frequently Asked Question(FAQ)
-
Q1: If I'm already proficient with MAGeCK, why should I use
iScreenAnlys™?
A: The iScreenAnlys™ library analysis platform is not a replacement but rather an intelligent encapsulation of tools like MAGeCK. While preserving core statistical methods, it offers a more robust quality control system, interactive visualization, and project management features—effectively upgrading existing workflow efficiency. -
Q2: How should small sample sizes or low coverage data be handled?
A: Such data can still be analyzed, but be cutious. The QC module of the iScreenAnlys™ library analysis platform identifies depth and coverage deficiencies, helping researchers objectively assess data limitations. -
Q3: Is the platform suitable for lab technicians without a
bioinformatics background?
A: Absolutely. The iScreenAnlys™ library analysis platform was designed to lower technical barriers, enabling lab personnel to execute industry-standard analysis workflows through a graphical interface.
Summary
The iScreenAnlys™ library analysis platform is an upgrade to traditional CRISPR screen analysis methods: efficient, reliable, reproducible, and accessible. Whether for small-scale experiments or complex projects, it empowers researchers to rapidly and accurately extract critical biological insights from their data.
Schedule a free trial of the iScreenAnlys™ library analysis platform right away. Experience a truly end-to-end CRISPR library analysis workflow: from raw data import, quality control, and normalization to differential analysis, visualization, and result interpretation—all efficiently completed. This empowers researchers to focus on science, not tedious operations.
Click to schedule and unlock a new era of intelligent analysis! >>
 Promotions